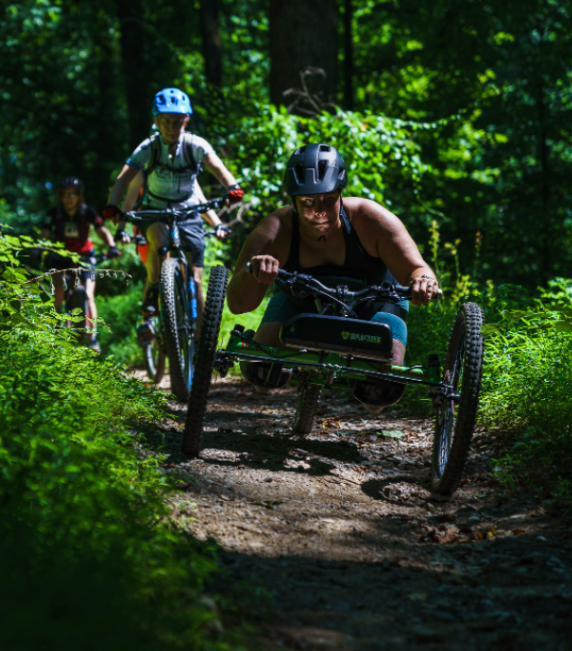
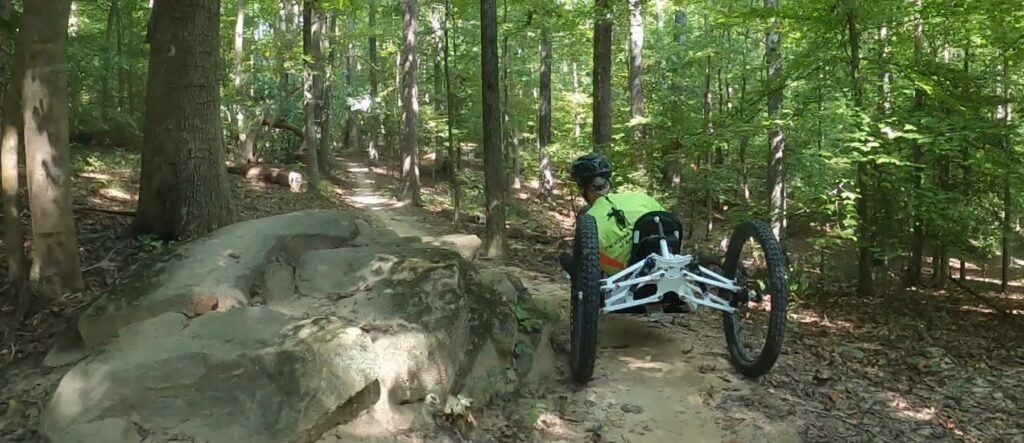
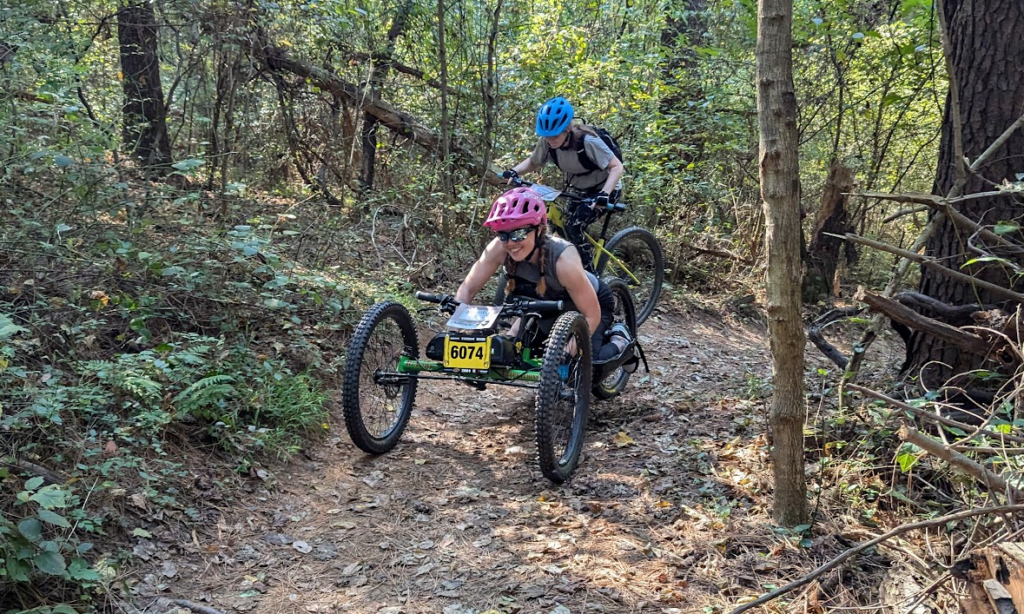
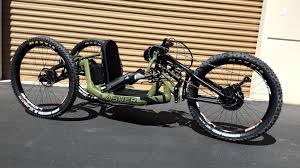
Recumbent Hand Cycle
This group of bikes are recumbent, propelled with your arms and controlled with your hands, power assist and have a throttle. Designed for rugged mountain bike trails.
Recommended for those with less trunk stability or problems getting into a kneeling position. You MUST have sufficient finger strength to operate a shifter and throttle and sufficient grip strength to operate a hand brake
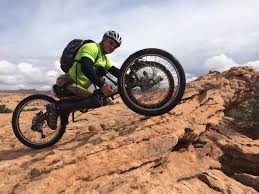
Prone Hand Cycle
This group of bikes are propelled with your arms and controlled with your hands and chest. The body position is kneeling, with your chest laying down on a pad. It has power assist and a throttle. Designed for rugged mountain bike trails.
Recommended for those with better trunk stability. You MUST have the flexibility in your legs to get into a kneeling position. You MUST have sufficient finger strength to operate a shifter and throttle and sufficient grip strength to operate a hand brake.
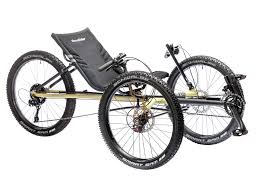
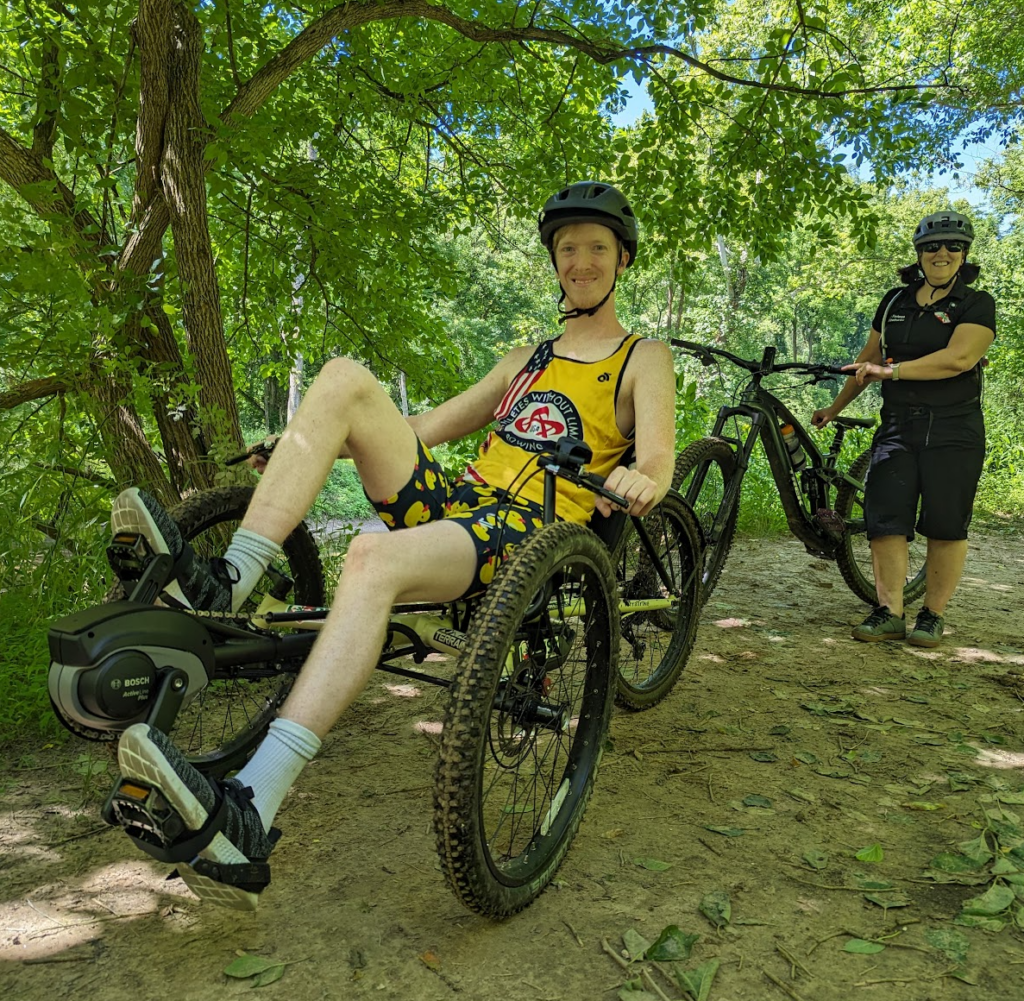
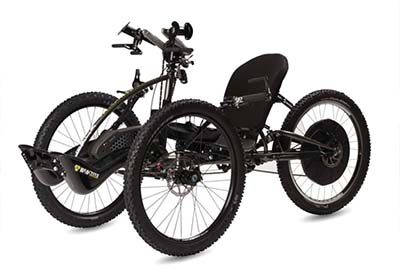
Foot Propelled Recumbent Trike
This group of bikes are recumbent, propelled by your legs and controlled by your hands on the shifter and brakes. It has power assist, but no throttle. Designed for moderate mountain bike trails.
Recommended for those with balance issues, below the knee amputations, and those with some leg weakness or coordination problems unable to ride a 2 wheeled bike. You must have sufficient flexibility in your legs to pedal.